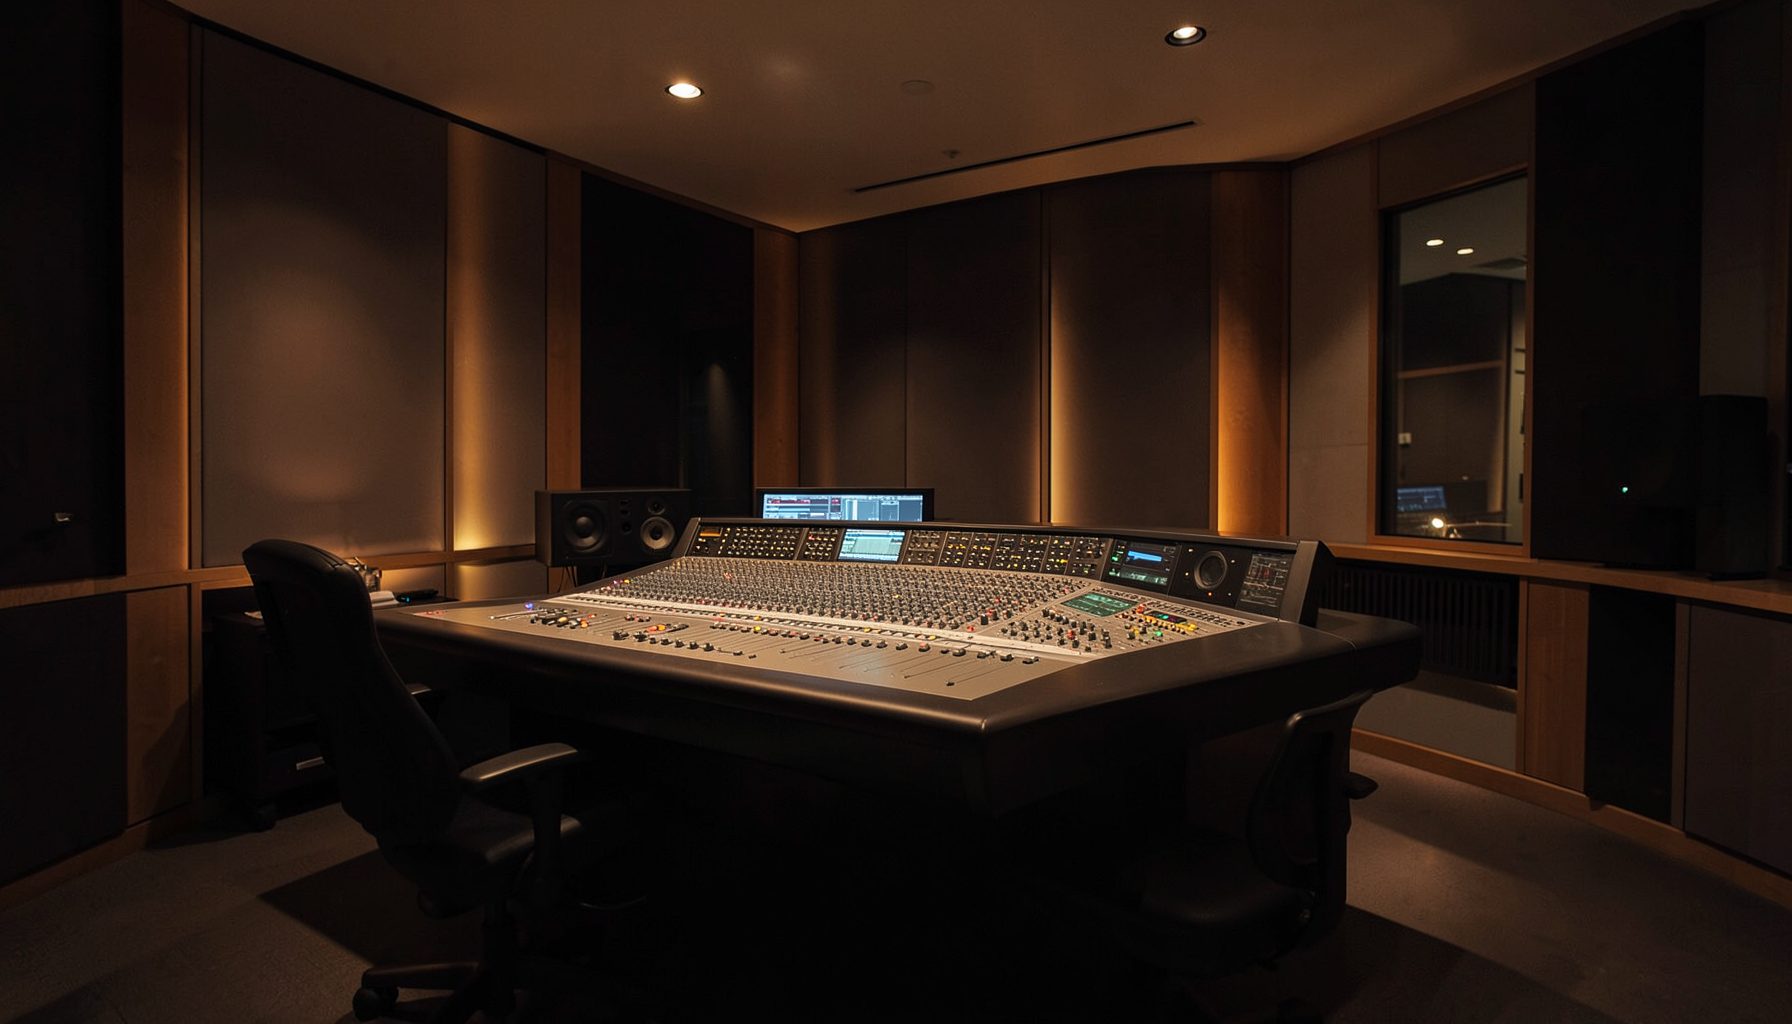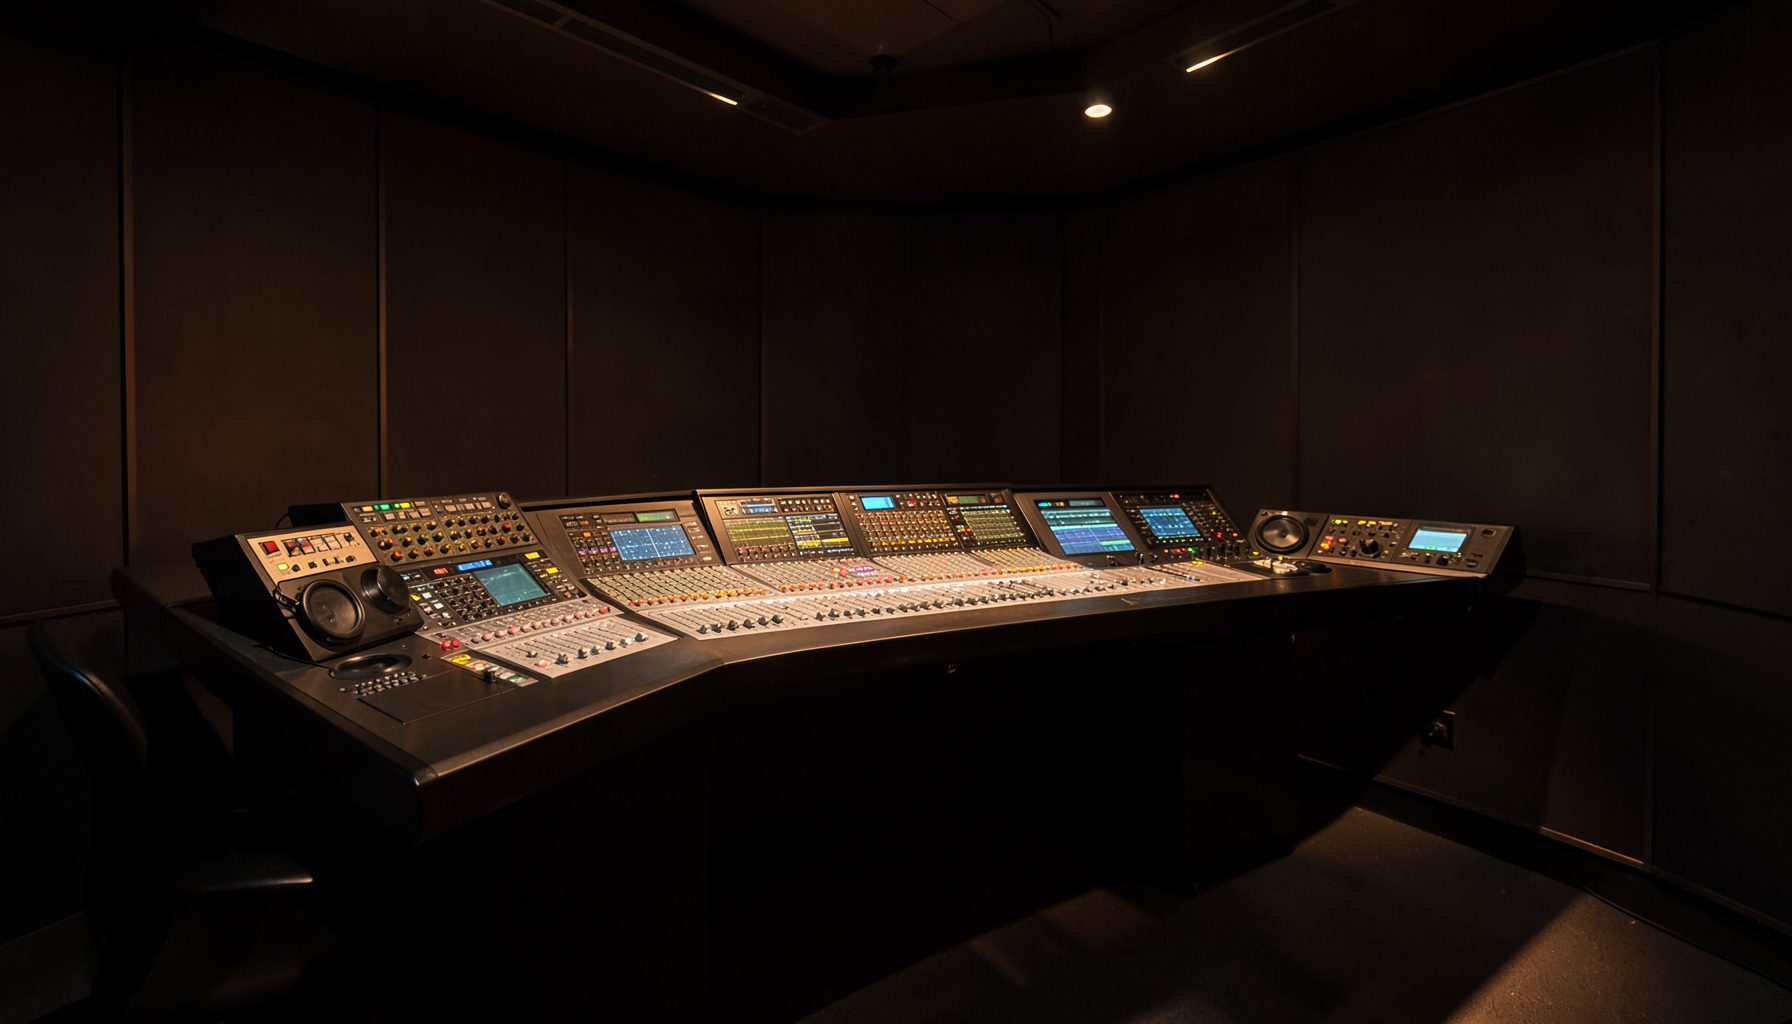
Building custom meter views in VisTool for broadcast control
A well-designed meter page gives an operator immediate answers: which source is active, where headroom is disappearing, and whether a fault sits in the studio, network, or transmission chain. In a busy radio control room, that clarity is more useful than displaying every available signal at once.
Lawo VisTool supports flexible visualisation for networked broadcast environments built around systems such as Power Core and Ruby. Engineers can arrange level meters, labels, status indicators, source controls, and alarm information into pages suited to a particular studio, programme format, or operator role.
For Australian broadcasters, the same layout may need to serve a metro breakfast show in Sydney, a regional station in Wagga Wagga, or a remote production workflow connecting Perth with the east coast. A practical metering design must therefore be readable, scalable, and easy to support across different sites and time zones.
Start with the operator’s decisions
Before placing a meter, identify the decision it supports. An announcer may need a compact view of microphone, playout, and monitor levels, while an audio engineer may require pre-fader, post-fader, bus, and transmission metering on separate pages. Grouping signals by task prevents the screen from becoming a crowded technical diagram.
A useful first page often contains the programme bus, presenter microphones, playout returns, external contribution feeds, and the final output. Keep the most important paths in a consistent position. If the studio is handling a live AFL broadcast or a community outside broadcast, operators should not have to hunt for the commentary bus when the segment changes quickly.
Choose meter types and scales carefully
Peak meters are useful for spotting sudden overloads, while loudness displays help assess programme consistency over longer periods. Where VisTool exposes different meter and status components, use each for a defined purpose rather than duplicating the same information in several forms.
Use a scale that suits the signal. Speech channels may benefit from a clear reference around normal operating level, while a final programme bus should show headroom and over indications prominently. Colour should reinforce meaning: green for normal operation, amber for attention, and red for an actual fault or overload. Avoid using bright colours as decoration because they lose their value during an on-air incident.
Build pages around signal flow
Arrange channels from source to destination, following the way an engineer thinks about the system. Microphones and studio sources can sit on the left, processing and mix buses in the centre, and monitoring or transmission outputs on the right. This approach makes the page easier to troubleshoot than an arrangement based solely on device names.
For a networked Power Core system, include clear labels for the source location and destination. “Studio 2 mic” is more useful than an abbreviated device identifier, especially when a support engineer is working remotely from Melbourne on a fault at a regional Queensland site. Add enough detail to distinguish left and right channels, main and backup feeds, and local versus remote contributions.
Keep the interface readable under pressure
A control surface or touchscreen is viewed at a distance, often in changing studio light. Use generous spacing, short labels, and a limited number of visual elements per page. Avoid making every meter the same size if that gives minor sources equal prominence with the programme output.
Create separate views for routine operation, engineering detail, and fault checking. A presenter page might show six to twelve essential meters, while an engineering page can expose additional buses, codec returns, and contribution paths. VisTool pages should support quick navigation, so the operator can move from an overview to a detailed source view without losing the overall context.
Include loudness and dialogue checks
Metering should reflect the content being produced. Speech-heavy radio, live sport, and music programming have different level patterns, so a single visual treatment may not suit every workflow. Include loudness information where consistency between segments, advertisements, and external inserts matters.
For productions using several lavalier microphones, level variation and bleed can make the dialogue bus harder to judge. The dialogue AutoMix guidance is relevant when designing a page that combines microphone activity, automatic mixing status, and the resulting programme level. Showing the processed bus alongside key source meters helps an operator understand what the mix is doing rather than reacting only to the final output.
Test, document, and maintain the layout
A custom page is complete only when it works during realistic operation. Test it with quiet speech, loud speech, music, remote guests, silence, and an intentional overload. Confirm that labels remain accurate after routing changes and that alarm colours are visible from the normal operating position.
Document the page name, signal sources, reference levels, and any permissions required to edit or operate it. This matters for Australian networks with shared engineering teams, after-hours support, and stations that rely on a mix of permanent staff and contractors. A short naming standard can prevent confusion between a Sydney studio template and a backup page used in Darwin or Hobart.
| Layout approach | Best use | Strength | Watch for |
|---|---|---|---|
| Compact overview | Presenters and routine playout | Fast situational awareness | Limited diagnostic detail |
| Source-to-output flow | Broadcast engineers | Matches troubleshooting logic | Requires disciplined labelling |
| Loudness-focused page | Speech, news, and network links | Supports consistent programme levels | Can hide individual source faults |
| Detailed engineering page | Commissioning and fault finding | Exposes buses and returns | Too dense for everyday operation |
Start by sketching one VisTool page with the programme bus, two primary microphones, playout return, remote contribution, and transmission output, then test that layout during a simulated live segment before adding further detail.